
A typical solar PV proposal includes various technical and financial data points. Typically included are:
- Details on the equipment to be installed
- Project costs
- Incentives/rebates
- Projections of future system performance
- Financial cash flows
- Project timeline
Customers must look at all of this data combined in order to make a decision between two different or competing proposals. Each design or proposal may use different assumptions for the system design, energy generation, and energy costs over a 20 – 25 year timeframe.
Of course, you should compare the apparent details like brand-name hardware, total cost, financing offers, warranties, etc. However, some of the underlying assumptions within each proposal are very important to understand in order to make an informed decision.
Here are four key concepts that are critical when comparing different options:
 1. Baseline Energy Consumption
The baseline from which all solar quotes are started is the historical or projected electricity consumption at a particular site. The first thing to check on a solar proposal is that the baseline site consumption accurately represents the correct consumption levels and utility costs.
Each quote should state the amount of kWh expected to be consumed as well as the accurate utility provider and rate schedule. Ensure that each proposal uses the same assumptions by confirming or calculating the annual consumption, estimated annual cost, and the average cost per kWh.
Example #1:
- Average monthly utility bill is ~$250 or ~1,000kWh
- Annual Cost: ~$3,000 / Annual Consumption 12,000kWh
- Average Utility cost: ~$0.25 per kWh
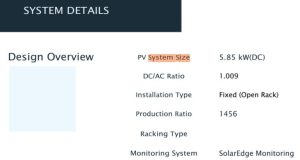 2. System Size
The first and obvious way to compare two solar quotes is to look at the total system size or nameplate capacity of each system. Solar PV systems are most often described by the total direct current (DC) capacity of the solar panels installed in kilowatts(kW).
It is important to compare the total number of panels and the capacity rating of each panel in watts. All solar panels are rated under the same standard test conditions (STC), which is the maximum energy (labeled in watts) generated in a lab controlled environment. However, some panels, even of the same wattage, may have slightly different lengths, widths, and total footprint (efficiency).
Example #2: 20 panels @ 400W each = 8,000 Watts or 8.0 kW DC STC
The specific location and layout of the solar panels will determine the capacity or number of inverters needed to convert the DC electricity generated by the solar panels into AC electricity that can power your home and/or interconnect to the local utility grid. The alternating current (AC) system size refers to the capacity of the inverter to produce energy in AC watts or kW AC. It is typical for the ratio of the DC to AC system sizes to be from ~1.1 to 1.3 to account for conversion efficiency, local climate conditions, and other technical design factors.
Example #2b: Inverter(s) with 7kW Max AC output = 7,000 Watts or 7 kW AC
Example #2c: 8.0kW DC panels / 7kW AC inverter(s) = 1.14 DC/AC Ratio
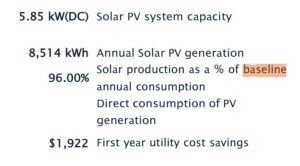
3. Energy Generation
The total amount of energy (in kWh) that a solar system will generate in a given year is determined by many factors including local weather patterns, azimuth/direction, tilt/pitch, and any trees or obstructions that may cast shade on the solar panels. Compare the estimated annual solar generation with your electrical consumption to determine the annual energy offset.
Example #3: 8.0kW PV system estimated to generate 11,500 kWh per year
Example #3b: Annual consumption of 12,000kWh = 95% Annual Energy Offset
In order to compare different system designs, you can calculate the relative generation efficiency of each system using the ratio of energy generated per kW of system capacity installed (kWh/kW). This is very helpful to compare the generation estimates of multiple system designs and show any differences in design. For residential PV systems, a typical generation ratio may range from 1,250 to 1,800 kWh/kW depending on the system design and location. If two seemingly similar quotes are showing drastically different ratios, then you should investigate further to ensure the proper design assumptions were used.
Example #3c: 11,500kWh generation / 8.0kW DC System size = 1,437kWh/kW
4. Avoided Cost of Energy
The average amount of utility cost avoided per kWh of solar generation is known as (ACOE). This metric measures the savings efficiency of a particular system design. Two proposals with the same or similar system size & design should have the same ACOE. However, a slight change in the system size or design may affect the ACOE either upwards or downwards depending on the situation. It is very important to understand how any decision on system size or design will affect the ACOE and overall outcome.
Example #4: $2,850 annual savings / 11,500kWh generated = $.24/kWh ACOE
Need help getting started in your solar journey? Talk to one of our solar energy consultants today!